(Ln(x))3

The everyday blog of Richard Bartle.

RSS feeds: v0.91; v1.0 (RDF); v2.0; Atom.

Previous entry. Next entry.


1:53pm on Thursday, 8th March, 2012:

Every Graph in Economics

Weird

The lecture before my Thursday CE317 lecture is in Economics. The lecturer never clears the whiteboard before he leaves; I clean it when I arrive.

Every week, he draws a new graph on the whiteboard. The words and symbols change from week to week, but the graphs always look something like this:


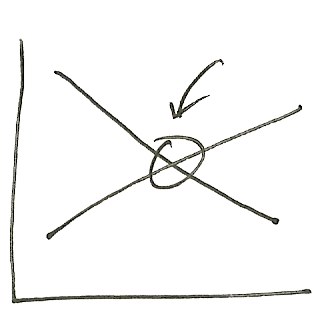
Sometimes there may be a dashed line going from the crossing point to an axis, and sometimes one or both of the lines may be slightly concave. However, basically he draws the same graph for every lecture.

Maybe I should only clean off the symbols and save him some time for the following week?


Latest entries.

Archived entries.

About this blog.

Copyright © 2012 Richard Bartle (richard@mud.co.uk).